Model Component Blueprint (Template) Contact Centre Shrinkage
Chart
Comparison Table
Show Logic
A pre-built component for building ROI Models & Calculators for Modern Contact Centre settings

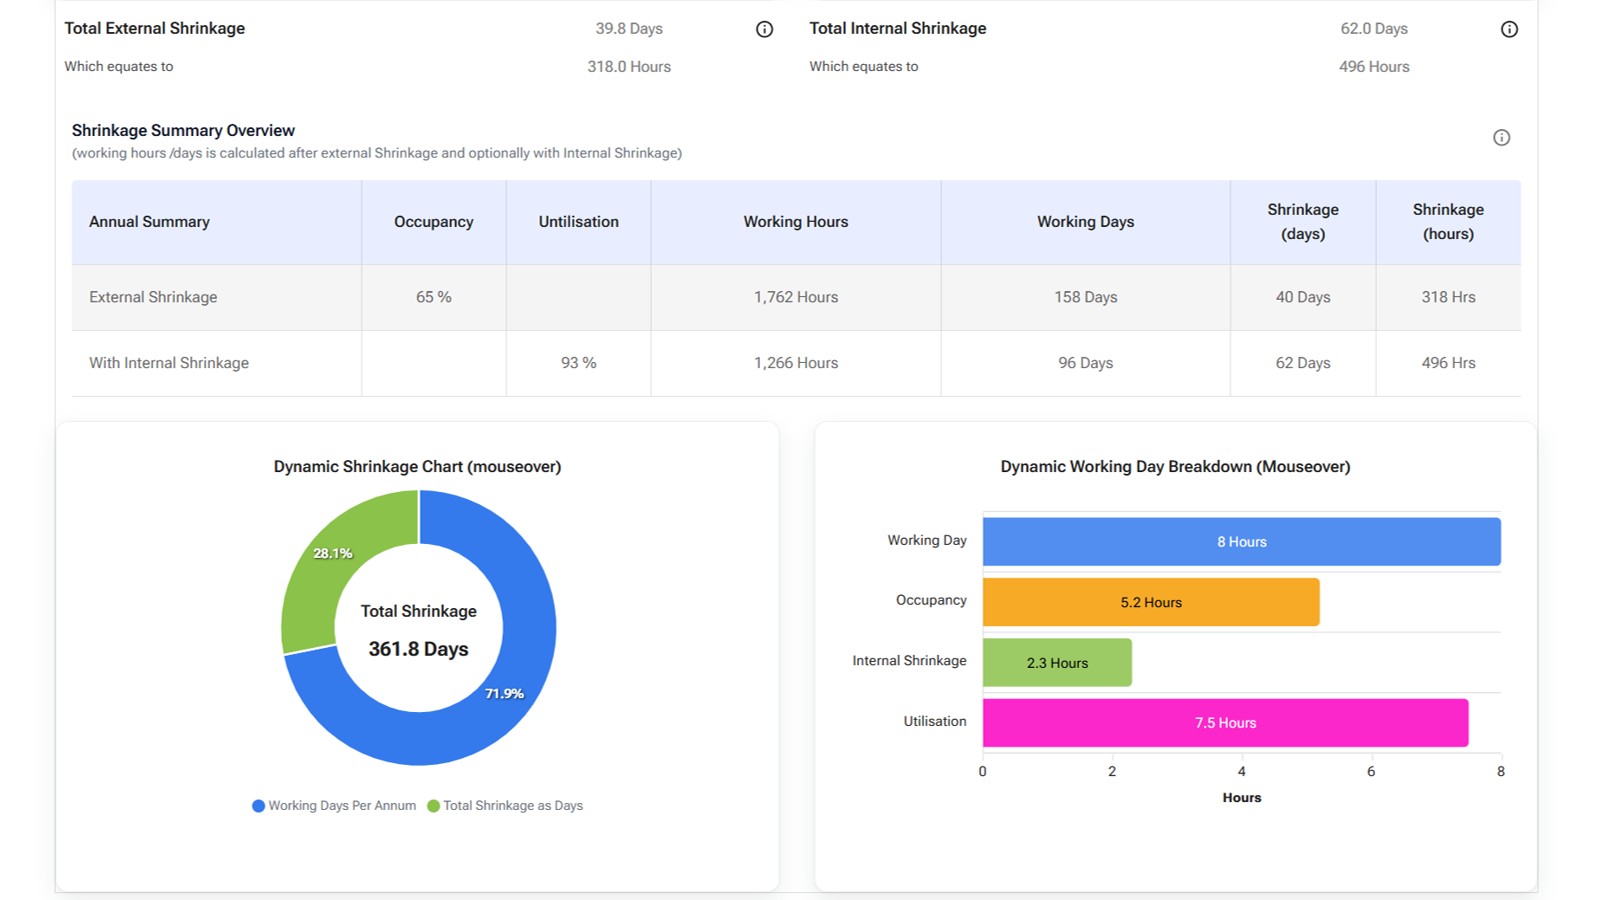
Contact centre shrinkage is one of the most important — and often underestimated — drivers of workforce planning, staffing costs, and service performance. Shrinkage represents the percentage of paid time that agents are unavailable to handle customer interactions due to planned and unplanned activities such as breaks, meetings, training, coaching, sickness, absenteeism, system downtime, annual leave, and administrative work.
Without accurately accounting for shrinkage, contact centres frequently underestimate staffing requirements, leading to understaffed operations, poor service levels, increased wait times, agent burnout, and higher operational costs.
This ROI model helps organisations quantify the true impact of shrinkage by analysing productive versus non-productive time, occupancy, utilisation, and available staffing capacity. By modelling both internal and external shrinkage factors, businesses can uncover hidden inefficiencies, identify recoverable agent hours, optimise workforce planning, and evaluate the financial return of operational improvements, automation, AI, or process changes.
Understanding shrinkage is critical because even small percentage improvements can unlock significant operational savings, improve customer experience, reduce overtime, and increase overall workforce efficiency across the contact centre.
The Contact Centre Shrinkage ROI Calculator is designed to help organisations understand how much productive capacity is being lost across the contact centre and quantify the operational and financial impact of inefficiencies.
In most contact centres, not all paid agent hours are spent handling customer interactions. A significant proportion of time is lost to planned activities such as training, meetings, coaching, annual leave, and breaks, alongside unplanned factors such as sickness, absenteeism, system downtime, and operational inefficiencies. This non-productive time is known as shrinkage.
The calculator allows businesses to model both internal and external shrinkage drivers, understand true staffing availability, and identify opportunities to recover capacity, reduce operational costs, and improve workforce efficiency.
By combining workforce planning assumptions, occupancy, utilisation, and shrinkage metrics, the model helps contact centre leaders evaluate the ROI of operational changes, workforce optimisation strategies, automation, AI tools, scheduling improvements, or process redesign.
The calculator estimates the true productive capacity of your contact centre workforce by modelling paid hours versus available customer-handling time. This helps organisations understand the gap between theoretical staffing and actual operational availability.
The model separates shrinkage into controllable and uncontrollable categories, helping businesses identify where efficiency improvements can realistically be made.
Typical shrinkage categories may include:
This distinction helps prioritise operational interventions with the highest return potential.
The calculator evaluates how effectively available agents are being used:
Understanding the balance between these metrics is critical, as excessively high occupancy can lead to burnout, while low utilisation often highlights overstaffing or inefficiencies.
The calculator identifies how many productive hours could potentially be recovered through shrinkage reduction and translates those improvements into equivalent Full-Time Employee (FTE) capacity.
This helps organisations answer questions such as:
The calculator converts workforce inefficiencies into financial outcomes by estimating:
This makes it easier to build business cases for workforce management initiatives, AI solutions, automation, scheduling optimisation, or process redesign.
Total Shrinkage (%)
Shows the percentage of paid workforce time unavailable for customer handling activities.
Why it matters:
Higher shrinkage means more staffing is required to maintain service levels. Even small reductions can generate significant cost savings.
Displays the proportion of time lost to operational activities within the organisation’s control.
Why it matters:
Helps identify operational inefficiencies that can potentially be improved through better planning, automation, or process optimisation.
Measures time lost due to factors outside day-to-day operational control, such as sickness or annual leave.
Why it matters:
Supports more accurate workforce forecasting and staffing models.
Shows the total number of hours agents are realistically available to handle customer interactions after shrinkage has been deducted.
Why it matters:
Provides a true view of operational handling capacity rather than relying on contracted hours.
Measures how busy agents are during available handling time.
Why it matters:
Very high occupancy can increase burnout and attrition, while low occupancy may indicate overstaffing or poor demand forecasting.
Shows how much paid agent time ultimately becomes productive customer-facing time.
Why it matters:
Helps evaluate overall workforce efficiency and staffing effectiveness.
Estimates the number of productive hours that could potentially be regained through shrinkage improvements.
Why it matters:
Represents hidden operational capacity that may reduce recruitment pressure or improve service levels.
Converts recoverable hours into the equivalent number of additional full-time employees.
Why it matters:
Makes efficiency opportunities easier to understand and communicate at leadership level.
Calculates the estimated financial savings associated with reducing shrinkage and increasing productive time.
Why it matters:
Provides a measurable business case for investment in workforce improvements.
Shows the estimated return generated from operational improvement initiatives over time.
Why it matters:
Helps determine whether investments in technology, workforce optimisation, automation, or AI deliver measurable financial returns.
Even a small reduction in shrinkage — often just 1–3% — can unlock substantial operational value in large contact centres. Improved workforce efficiency can reduce unnecessary hiring, improve customer experience, lower overtime costs, reduce burnout, and create measurable financial savings.
This calculator helps transform shrinkage from a workforce planning assumption into a measurable, actionable business improvement opportunity.